DadBodFootball Week 3 NFL Picks Against the Spread, Totals, and Implied Totals
Break Stuff To Look Tough
Just so we’re on the same page, it is a struggle to not tear apart the model and make it reliant on 2024 data as its core input. Clearly teams have changed - some are better than expected (the Saints), some are worse than expected (the Ravens) - however, what is generally true is that over the course of a season, very few teams improve or decline rapidly (barring injuries or suspensions to key players).
As such, I’m waiting until week 6 to completely overhaul the model’s data inputs but continue to ensure that teams are given some measure of credit for their 2024 performance.
The Jets - Patriots is a great example of how this can go so right (and so wrong). The Jets have clearly improved with Aaron Rodgers back at the helm for more than 6 snaps… The Patriots are better with Brissett but have taken a bit of a hit on the defensive side with the loss of Belichick. The model loved the UNDER, anticipating 34.5 points scored (27 points scored), but felt that the Patriots would muster around 14 points (averaging 20 PPG in 2024, but weighted down due to the Jets’ defensive efficiency). Clearly that didn’t happen, but it’s not like we had predicted them to win - especially noting during our Early Lines Preview that Thursday Night Football favors the Home Team to Win and Cover (63.6% of TNF matchups).
Some teams are difficult to assess, even for the model - the Bengals (0-2) and Ravens (0-2) fit this profile as their defenses continue to struggle and their offenses are closer to middling than historical performance would indicate (consistently top 10).
The OTHER item to consider here is that Vegas - does.not.care. This is baked in to lines and totals for 2024, and in some cases, Vegas will attempt to goad bettors to making decisions based on historical information. This is why the model is weighted 70% historical, 30% current season. While it is not perfect, it is the same split we used last season to generate a meaningful sample size on which to baseline efficiency and performance data.
Chasing Zebras - Are Underdogs More Likely To Cover A Large Spread In Low Implied Total (Low Scoring) Games?
This theory resulted from a comment I made in the Early Lines preview from this week - the model and I both agreed that the Patriots could cover a 6.5 point spread BECAUSE the Total (38.5) and Implied Totals (Jets 22.5, Patriots 16) were so low. The thinking/theory is that Underdogs are more likely to cover in low scoring matchups because there are fewer expected points. A field goal makes more of an impact in a 30 point game than a 60 point game (again, in theory).
The Method
Definitions:
Low Scoring Games: Games with an anticipated total < 43.5 points (43.5 is the average NFL game score 2022, 2023)
Large Spread: Spreads >= 6.5 points
Data Selected:
60 game subset across 2022 and 2023 (~8 weeks of games across each season)
All games with spread >6 points, two cohorts
Games with Total =< 43.5 points
Games with Total > 43.5 points
Outcomes
Games with Spread >6, Total =<43.5: 24
Favorite Cover: 29.2%
Underdog Cover: 70.8%
Games with Spread >6, Total > 43.5: 36
Favorite Cover: 50%
Underdog Cover: 50%
Quick Reaction: For reference, favorites cover ~52% of spreads, and in last week’s breakdown (LINK) we found that in pick-em games (spreads <=3.5 points), favorites cover nearly 65% of spreads. When the spread is larger (>6 points) but the total is low, favorites are only covering 29.2% of spreads.
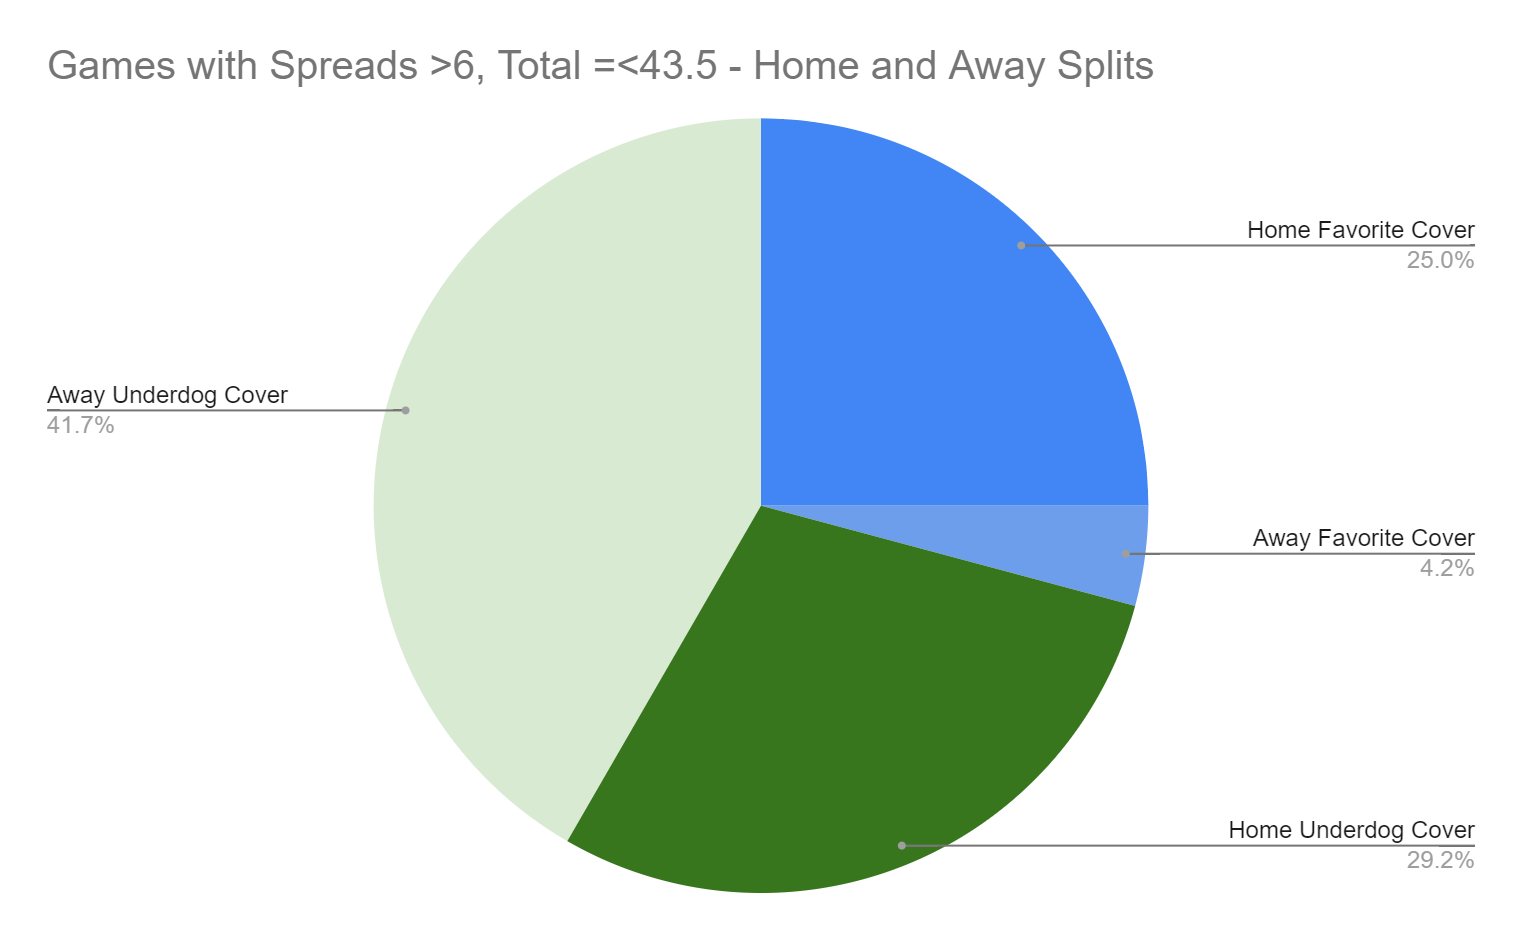
Next, I wanted to see if there was a difference between home and road splits for favorites/underdogs…
Looking at this a different way, we should compare Away Underdog Cover % and Home Favorite Cover % ; and separately, Home Underdog Cover % and Away Favorite Cover % to get an understanding of how likely it is that the road and home underdog covers (as a Home Underdog is playing a Road Favorite).
Takeaway
Underdogs playing on the road are over 1.5 times more likely to cover than the home favorite
In 16 matchups, 10 road dogs covered compared to 6 home favorites
Underdogs at home are nearly 7 times as likely to cover as the favorite playing on the road.
In fact, exactly 1 away favorite covered in 8 matchups where the home team was a 6.5 point or more underdog and the total was <43.5 (below average scoring).
DBF Note: A sample size of 8 is somewhat difficult to draw conclusions from, but there also aren’t many matchups in an NFL season where a home team is a huge underdog to a road team. Still, my natural inclination would be to bet the favorite in that scenario… and I’m so wrong.
Conclusion: Bet the underdog to cover a spread >= 6.5 points if the total is at or below 43.5 points
Notes that may only interest me:
Here’s the breakdown in games with a spread >=6.5 points but a total >=44 (above scoring average)
Favorite: 50% Cover Rate
Home Team: 63.9% Cover Rate
Home Favorite: 41.7% Cover Rate
Home Underdog: 22.2% Cover Rate
Underdogs playing on the road are 1.5 times LESS LIKELY to cover a spread >=6.5
Underdogs playing at home are only 3.5 times MORE LIKELY to cover a spread >=6.5
TL;DR - Bet the underdog in large spread, low total games - bet the favorite (especially if the favorite is at home) in large spread, high total games. This week, the New York Giants are 6.5 point underdogs on the road against the Cleveland Browns in a 38.5 point game. Historically, you should expect the Giants to cover.
Spreads, Totals
A note on Totals - even though I’m a little over 10 points below the anticipated Vegas points total, my view is that’s more a factor of a few low totals (four are less than 40), while there are still 8 that are expected to meet or exceed the 2022 and 2023 scoring average of 43.5 points per game. Don’t be afraid of the under this week.
Implied Totals
For those new to implied totals (or wondering what the heck I’m talking about) - an Implied Total is the expected points for ONE team in a matchup (with a TOTAL being both teams).
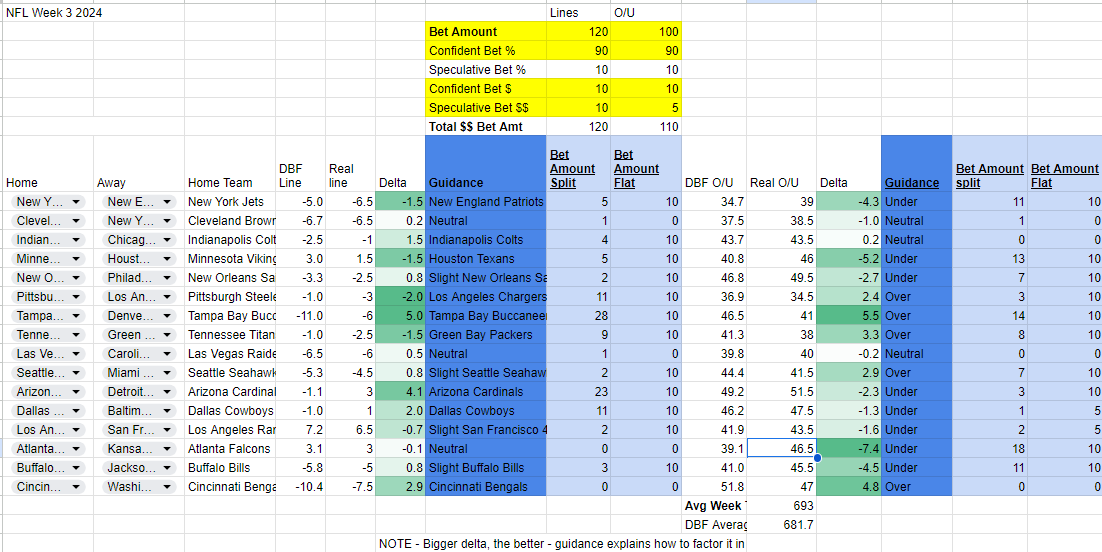
DBF Data points - Interpreting Implied Totals: In the DBF Tracker below, I include the Implied Total and delta to two other important data points
Average Points Scored: Informs how many points a team scores on average against a neutral opponent
DBF Points Expected: The Model’s output for expected points including adjustments for opponent defense, weather, home/road performance, injuries
This allows us to calculate the DOUBLE DELTA - how far off both average points and DBF Expected Points an implied total is. The more negative or positive, the more… theoretically… likely it is to be OVER or UNDER.
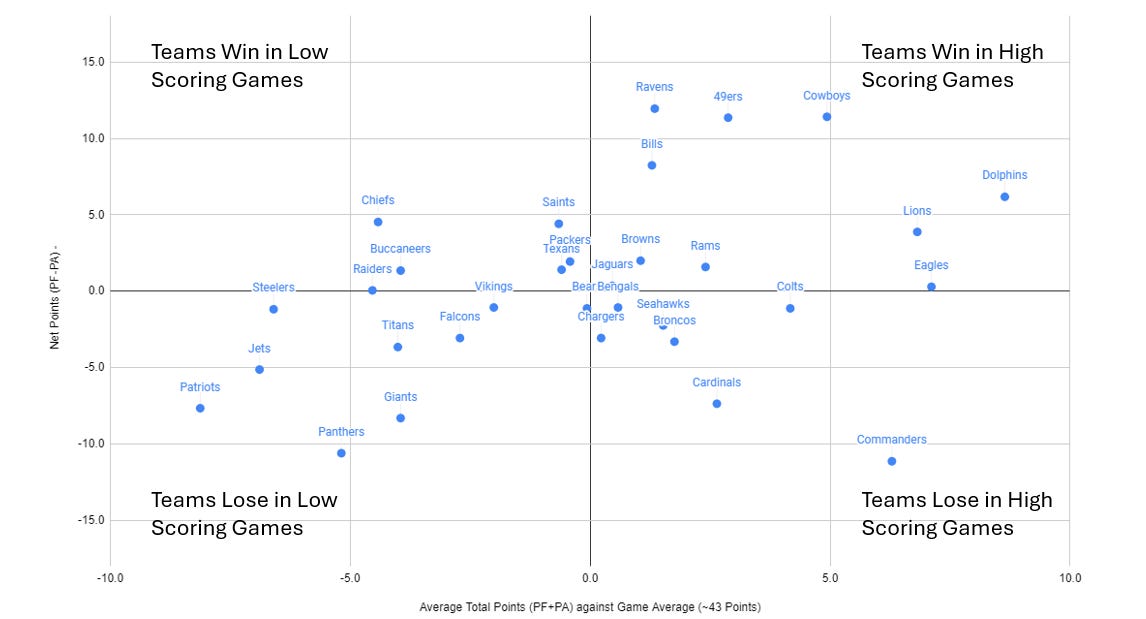
Winning Quadrants - Do Teams Win And How?
This is a mainstay of the weekly post - visit Week 10 of the 2023 season for a longer description Winning Quadrants graphic from Week 10. I’ll be adjusting to 2024 data right around Week 6.
Y-AXIS Net Points: The “higher” a team is on the Y Axis - the more team “Wins” by, and the “lower” - the more a team loses by.
X-AXIS Average Total Points (net 2023 NFL Scoring average of ~43.8 PPG) -The left-most teams participate in games with the lowest TOTAL points - the right-most teams participate in the highest scoring games. I netted (subtracted) season scoring average to show if they are above or below the average game.
How can you use this? Well - it’s an interesting way of aligning our “feel” about certain teams - the Dolphins tend to win and score a lot of points - and identify how they generally align against their spreads/totals.
For instance, the Falcons and Kansas City Chiefs both participate in games well below the 43.5 point line. This week’s total of 46.5 points feels too high (and the model supports that).
NFL Week 3 - 3 Pack
This new section is where I go a bit deeper on how the data and analytics in this post can be applied to a given week’s matchups. I wouldn’t say that these are picks - more how I’m feeling about a week’s set of lines, totals, and implied totals.
*** NOTE *** - I generally write these on Thursday/Friday before game day, so the lines may NOT be exactly as they are below, but the notes won’t change substantially.
Las Vegas Raiders (-6) vs. Carolina Panthers
A game where there is no pick? Spicy… but in all seriousness I’d stay away from it. Betting on teams who have recently made a quarterback and/or coaching are prone to a wide range of outcomes, so I wouldn’t expect this to be your father’s Carolina Panthers.
Philadelphia Eagles vs. New Orleans Saints (-2.5)
From our “Road Dogs” post last week - underdogs are LEAST likely to cover/win on the road when playing a divisional opponent. I’d take the Saints -2.5 as the better team getting effectively home field advantage - separately, last weeks low spread analysis the favorite will win and cover 65% of the time.
Detroit Lions vs. Arizona Cardinals (+125)
The Model LOVES the Cardinals this week to win at home, despite being a 3 point underdog. As above, if you’re going to bet the underdog in a low scoring game, take the odds not the points.
Model Performance Week 2 Recap
For those of us who are new - I model EVERY game’s spread and total, I do not make picks. Below I show both overall model performance (every pick ATS and Total) as well as call out those that are “High Confidence”
High Confidence represents the largest DBF Model deviation from the actual spread… for example, if Vegas has Team A as a 3 point favorite (-3), and DBF Model has Team A as a 10 point favorite (-10), our confidence score/delta is a 7. This also works the other way where Vegas has Team A as a 3 point favorite (-3), but DBF Model says the team should be 5 point underdogs (+5)…. that gives us a confidence interval of 8 (to bet on Team B).
I, personally, do not make every bet the model gives us - instead, I focus on 80% high confidence bets and 20% parlays or “feel” bets as a way to still enjoy the process (and lose money).
Spreads: 7-5-2 overall, 4-1 on high confidence spreads hit (7-3 across top 10 highest confidence).
Totals: 7-6-1 overall, 3-1-1 on high confidence totals (but 4-4-2 across top 10 highest confidence)
With our confidence based betting (bet more on games you’re more confident in), we netted a return of 20 units which I’m honestly proud of given just how poorly we bettors did.


