DadBodFootball - NFL Week 3 Early Lines, Totals, And Implied Totals (The TNF Post)
Crankin' Foamers
Much like Fair State Brewing’s lovable patio pounder (beer), bettors got absolutely CRUSHED last weekend. We saw teams score a collective 634 points - largely due to a league-wide regression in passing touchdowns and yards - which HUGELY favored the UNDER (10-5-1). Home teams struggled to win (let alone cover) - being favored in 10 matchups and losing 6 while not covering in 7. Home teams were washed out across the board, going 6 wins and 10 losses (historical averages have home teams winning and covering ~55% of all games).
If we evaluate the highest spread games, our outcomes look even worse…
NOTE - you can’t cover if you don’t win :-(
Baltimore Ravens LOSS vs Las Vegas Raiders (+8.5)
Dallas Cowboys LOSS vs. New Orleans Saints (+6.5)
Detroit Lions LOSS vs. Tampa Bay Buccaneers (+7.5)
Kansas City Chiefs WIN vs. Cincinnati Bengals (+6.5)
Houston Texans WIN vs. Chicago Bears (+6) - PUSH
Philadelphia Eagles LOSS vs. Atlanta Falcons (+5.5)
I wrote last week about the analytics behind taking the Underdog ML - in short, I called out the Browns (+135), Saints (+225), and Bengals (+205) as opportunities to pursue since the model didn’t strongly favor one team or the other. Going straight spread bets of 10 units would have yielded a 30 unit return, betting the ML - even losing the Bengals would have yielded a 36 unit return.
If you’re looking for historical comparisons - in all of 2022, there were 13 total games where an underdog with greater than +200 odds won - with Week 1 of that year providing 5 of those upsets. What this tells us is that if you’re going to exploit these ML opportunities - it’s best to do so early in the season when Vegas has less relevant information to go off of when evaluating matchups.
I’ll have more content during this week’s post around just how badly bettors were beaten up last weekend and perhaps what we can learn about it.
Model Performance
I’ll have a deeper dive during this week’s post, and for those of us who are new - I model EVERY game’s spread and total, I do not make picks…
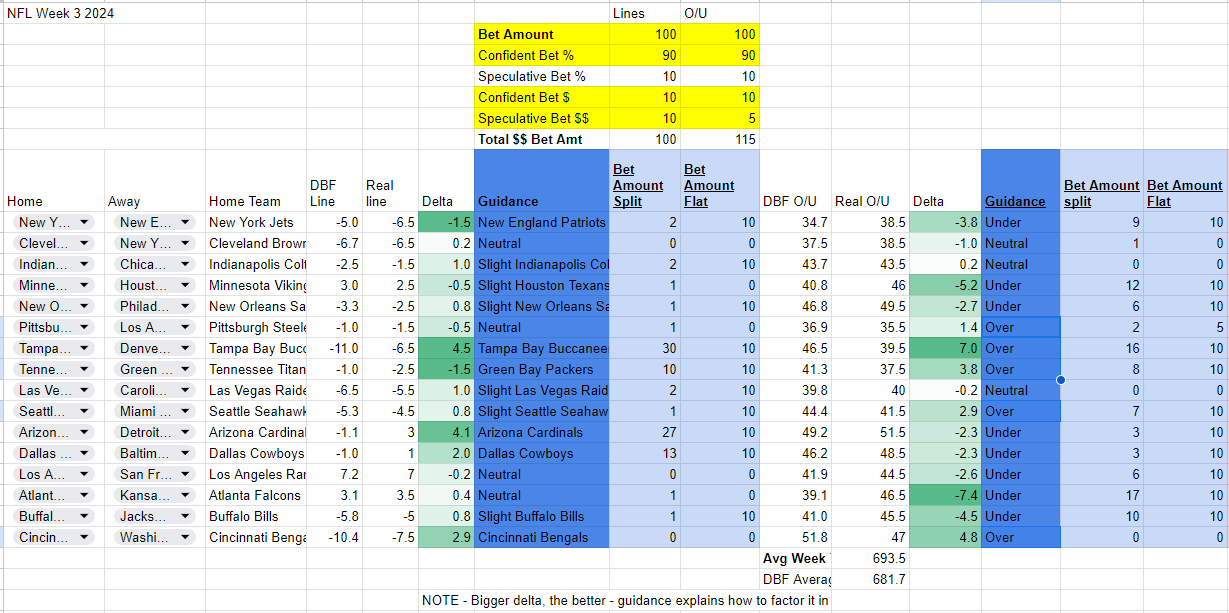
High Confidence represents the largest DBF Model deviation from the actual spread… for example, if Vegas has Team A as a 3 point favorite (-3), and DBF Model has Team A as a 10 point favorite (-10), our confidence score/delta is a 7. This also works the other way where Vegas has Team A as a 3 point favorite (-3), but DBF Model says the team should be 5 point underdogs (+5)…. that gives us a confidence interval of 8 (to bet on Team B).
Spreads: 7-5-2 overall, 4-1 on high confidence spreads hit (7-3 across top 10 highest confidence).
Totals: 7-6-1 overall, 3-1-1 on high confidence totals (but 4-4-2 across top 10 highest confidence)
With our confidence based betting (bet more on games you’re more confident in), we netted a return of 20 units which I’m honestly proud of given just how poorly we bettors did.
Early Spreads, Totals
Vegas is projecting 693.5 points, down from 701 projected last week. Vegas is reacting to the downward trend in scoring, but I still feel is putting reasonable totals out there. I’m weighted a bit toward the UNDER - projecting 682 points which is more or less in the middle of Week 1 and Week 2.
On Totals - I am weighted 8 UNDER, 5 OVER and 3 NEUTRAL; that said, it wouldn’t surprised me to see an 8 OVER - 8 UNDER finish this weekend. (NOTE - I called the 10 UNDER - “6” OVER split last week).
On Spreads - watch for significant line movement in the 49ers, Chargers, Panthers, Vikings games as we get injury news throughout the week. These injuries are already baked in to the Seahawks/Dolphins (no Tua) and Rams/San Francisco (no Puka, Kupp).
Implied Totals
For those new to implied totals (or wondering what the heck I’m talking about) - an Implied Total is the expected points for ONE team in a matchup (with a TOTAL being both teams).
DBF Data points - Interpreting Implied Totals: In the DBF Tracker below, I include the Implied Total and delta to two other important data points
Average Points Scored: Informs how many points a team scores on average against a neutral opponent
DBF Points Expected: The Model’s output for expected points including adjustments for opponent defense, weather, home/road performance, injuries
This allows us to calculate the DOUBLE DELTA - how far off both average points and DBF Expected Points an implied total is. The more negative or positive, the more… theoretically… likely it is to be OVER or UNDER.
The Thursday Night Football - Twist My Arm Pick
My hatred of betting on Thursday Night Football is well documented - from a modeling perspective, these games…
Favor the Over - 53.5% of games hit the OVER, compared to ~44% of Sunday/Monday games.
Favor The Home Team To Win and Cover - 63.6% of home teams win, compared to 54.5% of Sunday/Monday games.
Forcing myself to make a declaration, and ignoring everything I just said - give me UNDER 38.5 and Patriots +6.5. My belief is that it will be a low scoring game, and covering a 7 point spread is very difficult to do in a low scoring game (less points generally = tighter game). I think it comes down to a field goal/4 point game. But if you’re feeling frisky, why not slam the Patriots ML at +225 - even if it breaks every rule of our Road Dog theory from last week… the odds/statistics lean unlikely, not impossible.


