DadBodFootball Week 11 NFL Picks Against the Spread, Totals, and Implied Totals
Spreads, Totals, Implied Totals, and Team Power Rankings to Inform Your Betting Habits
Since I somehow mistimed my Week 10 post, I’m copying forward the key bit of content in to this week’s edition of DBF. We’re just past the halfway point and have at least 9 games worth of data for each team for the 2024 NFL Season. With the trade deadline in the rearview mirror, teams are largely who they are going to be for the rest of the season. Sure, injuries will occur - some teams will find a way through personnel and coaching changes to make improvements - but I wouldn’t expect teams to entirely change their trajectory in the coming weeks.
Why this matters is that the value of the data modeling can become a competitive edge - particularly as we evaluate spreads and implied totals as the model weights their opponent’s relative strength and home/road splits to better evaluate HOW a team might perform relative to Vegas expectations.
I’m excited to share a bit of the behind the scenes data that drives the DBF model and how teams stack up relative to their peers in 2024. This is not a static list by any means and teams will continue to improve or fall apart down the stretch - BUT! It’s another data point that will hopefully help you in your week over week evaluations of what spreads, totals, and implied totals you’ll bet.
Chasing Zebras - “Mid-Season” Power Rankings
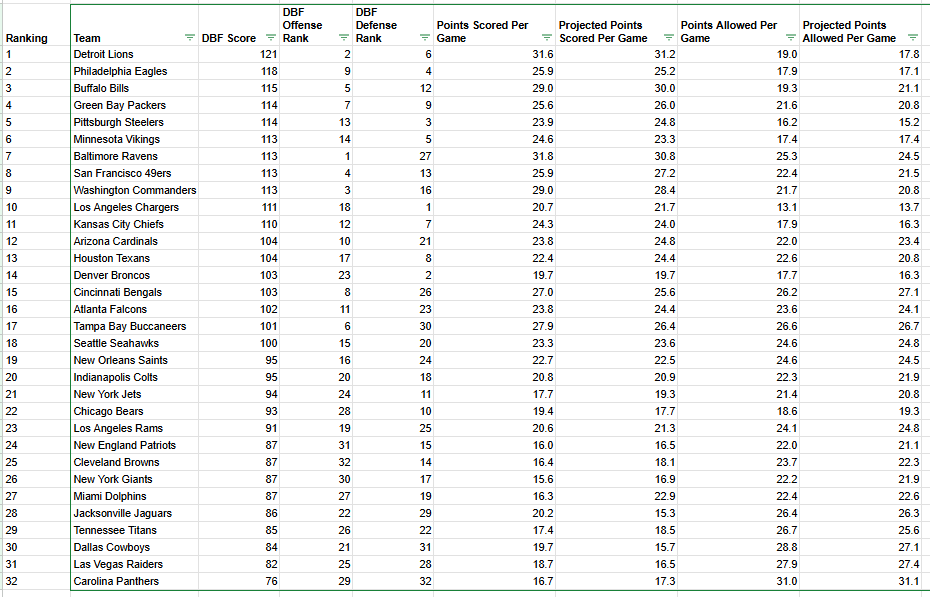
This idea initially debuted as part of my ill-fated DadBodFootballDoesBasketball (DBFDB) posts from earlier this year - the concept is…. how can I use the underlying data to come up with a composite score of individual team offensive and defensive performance. In the below table, I also include data like offense ranking, defense ranking, and Points Per Game Scored and Allowed, and Projected Points Per Game Scored and Allowed across the entire season (with a bit more context as to how I arrived at these numbers).
DBF Score: This is what ultimately drives the ranking - it is a composite score of the teams relative efficiency on both offense and defense. The Ravens are a great example where their offense is carrying a spectacularly mediocre defense.
DBF Offense / Defense Rank: How a team compares to the entire league on both offense and defense. There’s a lot more that goes in to the weekly Spread/Total/Implied Total calculations, but this is a simple enough way to understand what offenses and defenses are over/under performing.
Points Scored Per Game: Simple - total points scored divided by number of games played
Projected Points Scored Per Game: This is where the model becomes part art and part science… it calculates a weekly total for each team relative to existing variables and historical performance (i.e. how the 14th ranked offense would perform across a season where the average - 16th ranked offense - puts up XXX points). You’ll note that the Dolphins are expected to rank much higher to end the season than they performed historically.
Points Allowed Per Game: Total points allowed divided by number of games played
Projected Points Allowed Per Game: Similar to Projected Points Scored Per Game - this is how the defense can be expected to perform for the rest of the season given historical trends and averages.
Spreads, Totals
Note: I model every matchup’s spread, total, and implied totals leveraging a data model rooted in historical (3+ seasons) worth of offensive and defensive scoring, team-specific efficiency (i.e. Red Zone TD %s), home and road performance, and variables like injuries to QBs, new head coaches, and Matt Patricia.
The only updates I generally make are to the variables - i.e. Davante Adams is unable to go this week. Lines will move throughout the week, so if the DELTA (the net difference between the data model’s predicted spread/total/implied total and the actual spread/total/implied total) is small, there’s a good chance that the guidance will go to neutral or to the other team as the week evolves.
Columns Explained
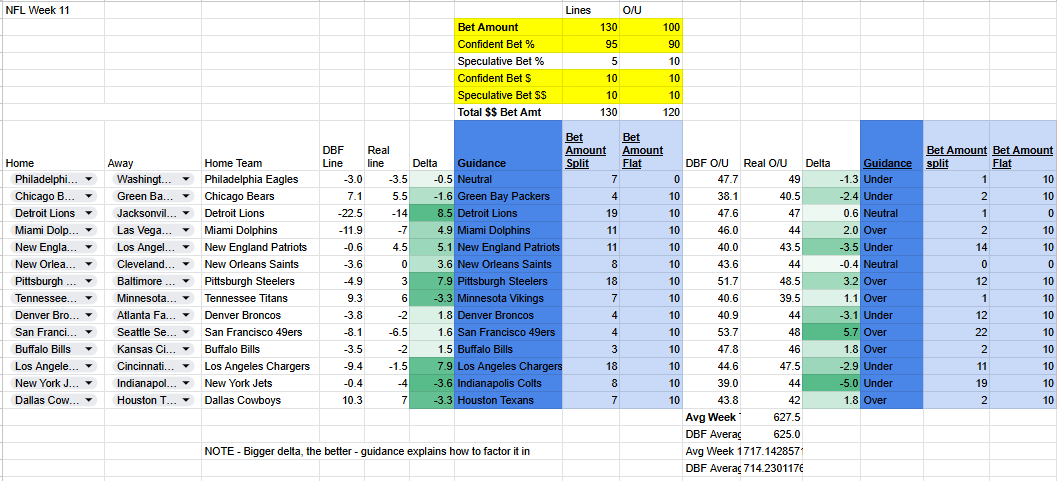
DBF Line - the model’s calculated line for the game
Real Line - the Vegas offered line for the game (usually within 0.5 points of most books)
DBF O/U - the model’s expected point total for the game
Real O/U - the Vegas offered line for the game (usually within 0.5 points of most books)
The DELTA - the net difference between the data model’s predicted spread/total/implied total and the actual spread/total/implied total provided by most betting sites. The higher the delta (in either direction) the more confident we are in the bet because, according to the data, the spread/total/implied total should be lower or higher than it is.
Implied Totals
For those new to implied totals (or wondering what the heck I’m talking about) - an Implied Total is the expected points for ONE team in a matchup (with a TOTAL being both teams).
DBF Data points - Interpreting Implied Totals: In the DBF Tracker below, I include the Implied Total and delta to two other important data points
Average Points Scored: Informs how many points a team scores on average against a neutral opponent
DBF Points Expected: The Model’s output for expected points including adjustments for opponent defense, weather, home/road performance, injuries
This allows us to calculate the DOUBLE DELTA - how far off both average points and DBF Expected Points an implied total is. The more negative or positive, the more… theoretically… likely it is to be OVER or UNDER.
Winning Quadrants - Do Teams Win And How?
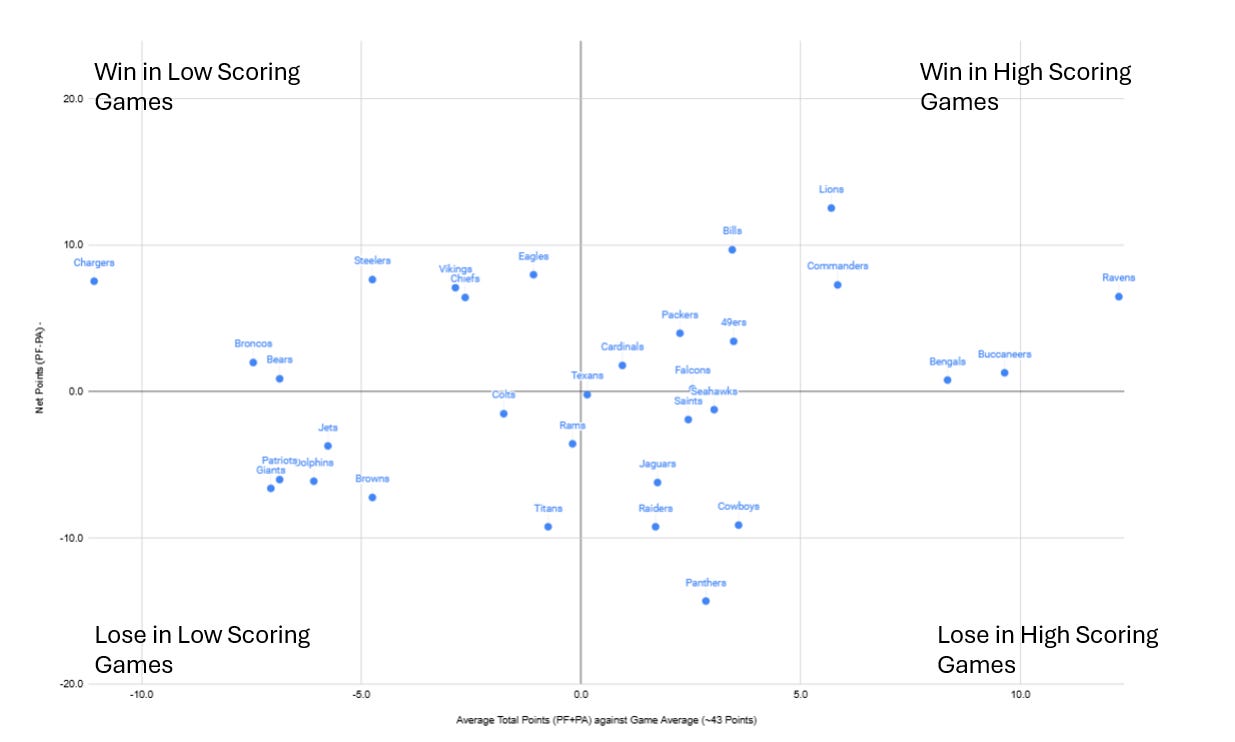
This is a mainstay of the weekly post - visit Week 10 of the 2023 season for a longer description Winning Quadrants graphic from Week 10. I’ll be adjusting to 2024 data right around Week 6.
Y-AXIS Net Points: The “higher” a team is on the Y Axis - the more team “Wins” by, and the “lower” - the more a team loses by.
X-AXIS Average Total Points (net 2023 NFL Scoring average of ~43.8 PPG) -The left-most teams participate in games with the lowest TOTAL points - the right-most teams participate in the highest scoring games. I netted (subtracted) season scoring average to show if they are above or below the average game.
How can you use this? Well - it’s an interesting way of aligning our “feel” about certain teams - the Ravens tend to win and score a lot of points - and identify how they generally align against their spreads/totals.
The Jets and Colts tend to participate in games with totals below 43.5 points - yet their total this week is 44. This is an opportunity to bet the under knowing that you’ve got a few points to play with (5 according to the model).
NFL Week 11 - 3 Pack
This new section is where I go a bit deeper on how the data and analytics in this post can be applied to a given week’s matchups. I wouldn’t say that these are picks - more how I’m feeling about a week’s set of lines, totals, and implied totals.
*** NOTE *** - I generally write these on Thursday/Friday before game day, so the lines may NOT be exactly as they are below, but the notes won’t change substantially.
Total Record (Since week 7)
14-4
This Week
Jacksonville Jaguars vs. Detroit Lions -14, Jacksonville Jaguars Under 16.5
Smart betting would tell you never a team to cover a 14 point spread, but no team is hotter than the Lions right now as they’re the number 1 team in DBF’s power index and are a whopping 22 point favorite according to the model. With Mac Jones starting under center and the Jaguars tilting towards giving up on a lost season, I don’t expect this one to be particularly close.
Atlanta Falcons vs. Denver Broncos -2, Under 44
The Broncos boast one of the top defensive units and with Kirk Cousins’ inability to move from his spot or feel pressure off the edge, I expect this to be a defensive battle (thus the under).
Baltimore Ravens vs. Pittsburgh Steelers +3, UNDER 48.5
The model loves the Steelers to win outright as they’re the better team according to the DBF power index. AFC North matchups typically favor the home team, and I’m going against the model and picking UNDER the 48.5 point spread because Ravens-Steelers games are typically low scoring, slobbernocker affairs.
One interesting tidbit, the Ravens Pass defense is the worst in the NFL at covering the deep middle of the field. Enter Russell Wilson - a QB who refuses to throw to the middle of the field. It will be interesting to see how this one plays out.
Green Bay Packers -5.5 vs. Chicago Bears, Chicago Bears Under 17.5 points
The Packers are coming off a bye and hopefully returning most of their starting core on offense and defense. Their defense is rounding in to form to make a playoff push - which is precisely the opposite of what the Bears’s offense is doing. Normally firing a coach gives a team a boost, but also pushing to bench your starting QB for Tyson Bagent is usually NOT a sign of good things to come.
Implied Total Quick Hitter
New York Jets UNDER 24 - they average 17.7 PPG, are expected to score 19.7 against the colts’ average defense.
LA Rams UNDER 24 - this is actually a matchup where the model likes the home underdog Patriots. It is seeing this as a low scoring, grind it out affair so both teams’ unders are appealing.
What the model (probably) got wrong this week!
There’s a lot of sorcery in predicting how the Dolphins offense will perform now that they’re healthy (though Tyreek may still be injured?). Stay away from bets in that game.
I love the Bills -2 at home against the Chiefs… I do NOT love the OVER in that game though.
Model Performance
Reminder - the model GUIDANCE and not PICKS. I run every game through the model to identify opportunities where the underlying scoring and efficiency data does not align with the Vegas Spread and Total. I’ll continue to include WAR score here and a link to the post explaining why / how we can use it to determine if we’re hitting our most confident bets.
On Spreads, we went 8-4 with a WAR of 285.9. This means that not only did the model accurately predict a majority of spreads, but it correctly predicted the highest confidence/largest delta spreads too.
On Totals, we went 6-6 with a WAR of -0.5. Given that the model was aligned to points predicted for Vegas and the UNDER carried 9 of 14 matchups, I’ll take a basically 0 WAR because we were as right as we were wrong in a week with tremendous downside due to high-point weighting from previous weeks’ OVER bias.
On the season that brings us to…
Spreads - 73-62-7; WAR: 545.1; given we run this model and record for ALL matchups, the model is absolutely humming on spreads (in that it is correctly predicting what spreads are outliers relative to the data).
Totals - 72-61-7; WAR: 256.7; again, we’re seeing traction in that the model is nailing the large delta TOTALS and missing those that are close. When you count every game/pick in your record, it’s okay to be hovering around 54%. You want the higher deltas to be your wins.


What’s the opinion on Texans @ cowboys tonight