


DadBodFootball Week 17 NFL Picks Against the Spread, Totals, and Implied Totals
The Penultimate Countdown

Two weeks left in the 2023 NFL regular season, and this is arguably the more important of the last two. For starters, most fantasy football leagues have their championship game this week. Second, the playoff scenarios can largely become more clear if teams win this week (and could rest their starters next week).
I mentioned this in my Early Line Preview - there are really only three teams you could argue are throwing in the towel - The Broncos (starting Siemian), The Commanders (starting Brissett - though he just pulled a hamstring in practice so who knows), and the Bengals (too injured to put up a fight against the Chiefs). You could also add the Vikings (starting Jaren Hall) and the Jets to the mix - particularly after the Jets looked entirely ready for the offseason on Thursday against the weirdly hot Browns.
Speaking of the Browns - the Ravens fan in me loves seeing Flacco succeed, but he’s also the last QB I want to see get hot for a playoff run in the AFC.
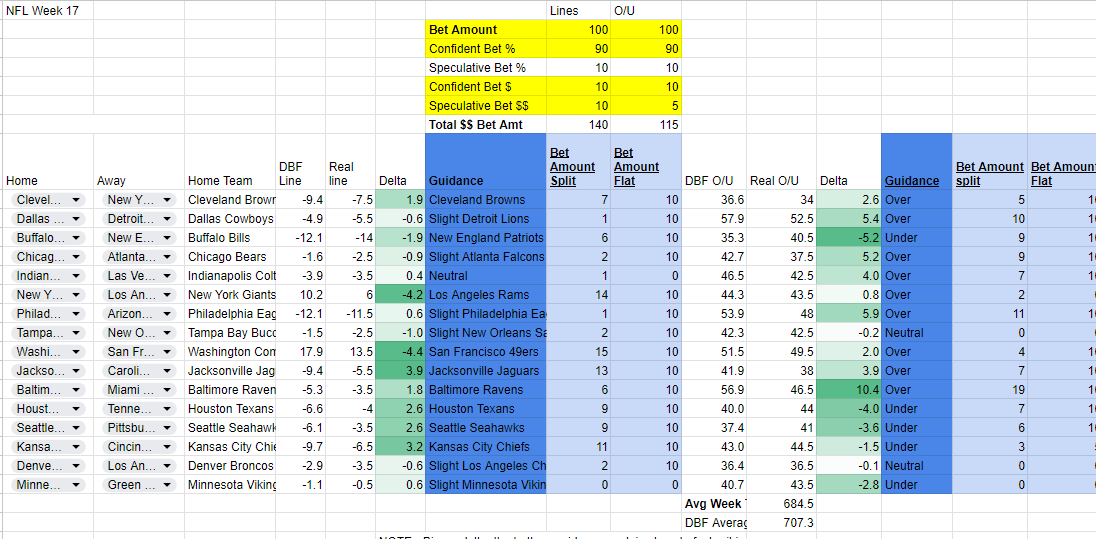
NFL Week 17 Guidance
Of the 5 teams that were favored by 5.5 points or more last week, exactly 0 covered - yes, you read that correctly… 0… and 3 of those 5 teams lost (Chiefs, 49ers, Broncos).
Do I think we’ll see the same trend this week? No, but statistically speaking, at least ONE underdog will win a large spread matchup.
The two games where the underdog is most likely to cover per the model are:
Patriots +14 vs. Bills
Lions +5.5 vs. Cowboys
In looking at totals, I’m much higher than Vegas after learning my lesson last week - we’re tilted towards the OVER and the model has been adjusted to give bad offenses more of an advantage against bad defenses.
The model expects 707 Total points against Vegas’s 684.5
Spreads, Totals
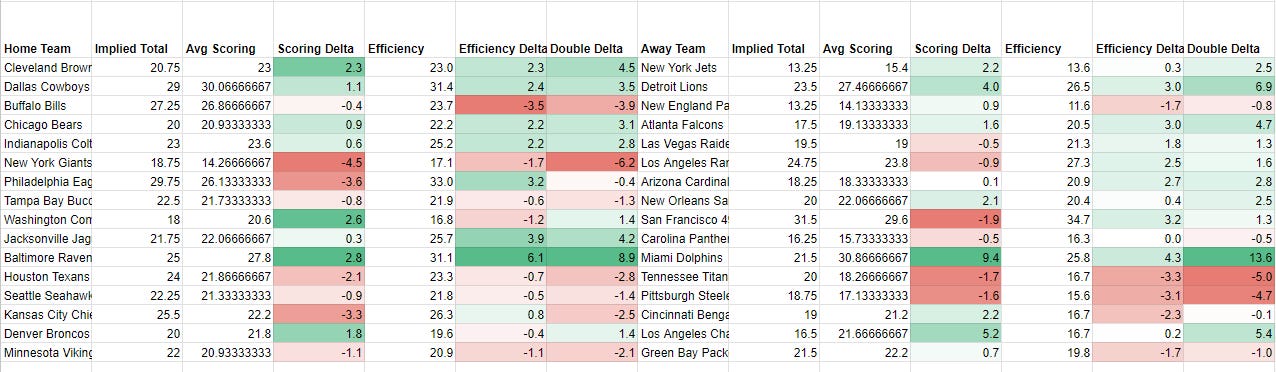
Implied Totals For Week 17
For those new to implied totals (or wondering what the heck I’m talking about) - an Implied Total is the expected points for ONE team in a matchup (with a TOTAL being both teams).
DBF Data points - Interpreting Implied Totals: In the DBF Tracker below, I include the Implied Total and delta to two other important data points
Average Points Scored: Informs how many points a team scores on average against a neutral opponent
DBF Points Expected: The Model’s output for expected points including adjustments for opponent defense, weather, home/road performance, injuries
This allows us to calculate the DOUBLE DELTA - how far off both average points and DBF Expected Points an implied total is. The more negative or positive, the more… theoretically… likely it is to be OVER or UNDER.
Winning Quadrants - Do Teams Win And How?
This is a mainstay of the weekly post - visit Week 10 for a longer description of Winning Quadrants graphic from Week 10
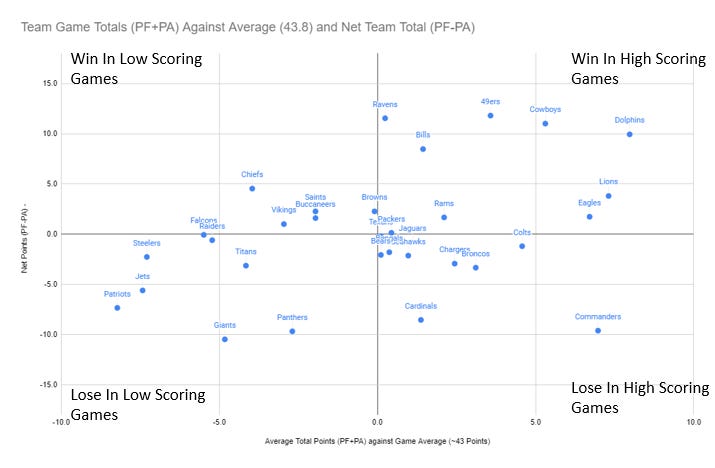
Y-AXIS Net Points: The “higher” a team is on the Y Axis - the more team “Wins” by, and the “lower” - the more a team loses by.
X-AXIS Average Total Points (net 2023 NFL Scoring average of ~43.8 PPG) -The left-most teams participate in games with the lowest TOTAL points - the right-most teams participate in the highest scoring games. I netted (subtracted) season scoring average to show if they are above or below the average game.
How can you use this? Well - it’s an interesting way of aligning our “feel” about certain teams - the Dolphins tend to win and score a lot of points - and identify how they generally align against their spreads/totals.
For instance, the Chiefs generally win by a lot in low scoring games - the Bengals lose by a small amount in games that are right around league average in scoring (43.8 points). The Total is 44.5 - so we could use this to tilt towards the UNDER. As for the Spread, Chiefs -6.5 is a lot of points, particularly with Chase back - that said, I think the Chiefs have a bounce back game and the model likes them to -9.7.
Week 16 Model Performance Recap
The model selected 16 lines as favorable and went 6-10. We lost 4 matchups by a combined 5 points, and lost big on the heavy favorites to cover (none of them did). There will always be weeks where teams under/over perform relative to expectations, and this just happened to be a particularly sideways week.
The model selected 15 totals as favorable going 6-8-1. I mentioned this in my outline last week that we were tilted towards the over, but only by a few points - which is what bit us. The OVER was 11-4-1 last week. We adjusted accordingly this week.
Overall, the model went 12-18-1 on guidance and lost net $60 + a returned $10 bet on the push… This was our first losing week since Week 7 and all told, not the worst given just how poorly the favorites performed and how poorly we adapted to the OVER.